Price action since the February volatility shock suggests that investors continue to grow more confident in the durability of US risk assets. Central bank quantitative easing (QE), robust corporate earnings, share buybacks, and tax incentive-driven repatriation have muted the negative impact of unexpected election outcomes, strains on geopolitical and economic alliances, and the recent imposition of tariffs on Chinese goods. Despite what should be an environment of greater uncertainty, S&P500 implied volatility as measured by the VIX has declined back to early February levels, even given the scaled-back presence of structural vol-selling funds such as SVXY and the now defunct XIV.
Not surprisingly, economic strength and higher stock returns have led investors to deeply discount risk in other asset classes, particularly in credit and G10 FX. Much of the complacency can likely be attributed to a prolonged period of low and stable global yields and credit spreads resulting from QE programs and outright asset purchases. The low-yield environment has been further reinforced through trend-following strategies, sales of volatility and risk-premia harvesting strategies.
More recently the combination of a strong dollar, steady US GDP growth, low unemployment with stable inflation, and impressive corporate earnings have attracted inflows to the perceived safety of US stocks at the expense of externally capital-dependent emerging markets. Volatility in EM in this cycle has so far been isolated to individual markets due to local political or economic uncertainty, but the broader credit sector could now be susceptible to the effects of tighter financial conditions, a drawn out trade war between the world’s two largest economies, and a secular commodity price decline.
Conditions in the second half of the year are beginning to look comparable to past cycles where isolated EM widening led fixed-income spread product underperformance despite a buoyant stock market. While the compression of spreads in EM, HY and IG corporates typically progresses over several quarters, widening and losses are more likely to cascade in a panic-infused liquidation. This especially occurs in periods of rising yields, the most memorable of which was the ‘Taper Tantrum’ which started in May 2013 (where UST 10y yields rose 110bp from May to early July 2013).
Could Italy, Argentina, Turkey and CNY be signaling a similar episode of spread product underperformance on a wider scale? Pricing tail risk in peripheral economies and EM is generally limited to evaluating and gauging local developments, but eventually the common challenges facing EM and DM economies can become widespread, magnified by tighter global financial conditions and trade tensions. Add to this a pervasive lack of liquidity in EM, US IG Corp and HY and dealer balance sheet constraints, which makes risk reduction challenging even in the best of times; and could render an unwind virtually unmanageable during a systemic shock. ETFs, which offer daily liquidity, may exacerbate this phenomenon.
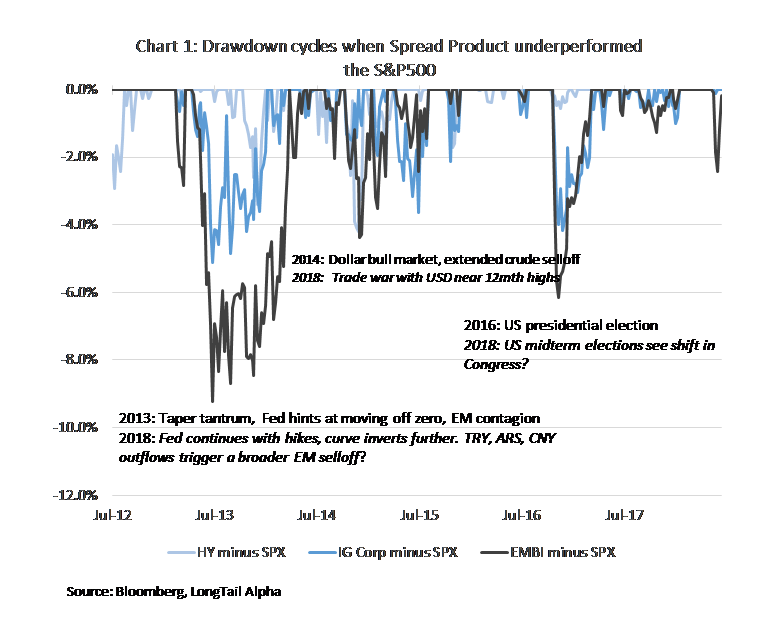
Chart 1 below shows different time periods where EM, IG Corp and HY debt indexes each experienced losses and underperformed the S&P 500 at the same time. Drawdowns in EM have been most significant, followed by those in High Yield and IG Corps. What is evident is that losses across these asset classes have largely been coincident, and one can draw parallels to today’s conditions such as rising rates, higher funding costs, dollar strength, and a critical US congressional election in just over three months.
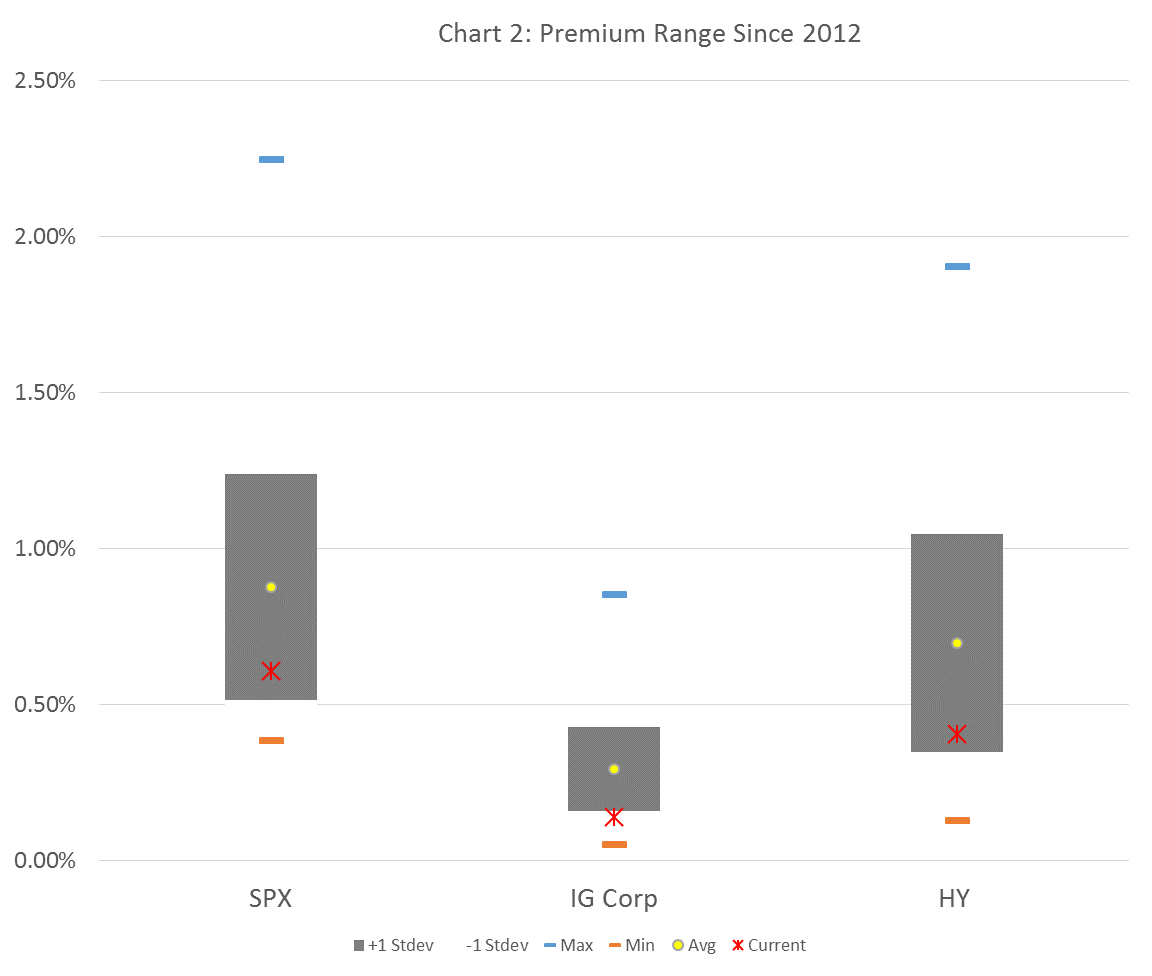
Given that it is still relatively inexpensive to purchase option protection on DM credit instruments, investors can consider opportunities to reduce risk using options on ETFs which track HY and IG Corp indexes. Chart 2 below shows the relative cost of a 3mth out-of-the-money put option for three liquid products.
For example, over the last six years the average drawdown in the US HY index relative to the S&P500 has been about 4%, and cycles have lasted anywhere from 3 to 6 months. This size drawdown in the index is roughly equal to 135bp of HY CDX credit spread widening. Investors willing to spend roughly 8-10bp of breakeven spread widening can purchase out-of-the-money puts to protect against losses in the High Yield index due to higher rates, spread widening or both. This cost of protection looks attractive when compared to the HY-CDX spread widening of 80bp in Late January to March 2018, or the 250bp of widening after the CNY revaluation in August 2015.
Summary
Although the risk of a systematic widening in EM and a more retaliatory response by China to the Trump administration’s tariffs should be expected to negatively impact equities and commodities, credit indexes can also experience drawdowns in total return terms, especially in periods of gradually rising rates. In our view, credit protection appears cheap relative to equity options. For investors concerned about left-tail risk in the next several months, particularly in fixed-income, it may be prudent to consider protection on spread products.
IMPORTANT DISCLOSURES
Ken Miller, CFA is a Portfolio Manager for LongTail Alpha, LLC. Any opinions or views expressed by Mr. Miller are solely those of Mr. Miller and do not necessarily reflect the opinions or views of LongTail Alpha, LLC or any of its affiliates (collectively, “LongTail Alpha”), or any other associated persons of LongTail Alpha. You should not treat any opinion expressed by Mr. Miller as investment advice or as a recommendation to make an investment in any particular investment strategy or investment product. Mr. Miller’s opinions and commentaries are based upon information he considers credible, but which may not constitute research by LongTail Alpha. Mr. Miller does not warrant the completeness or accuracy of the information upon which his opinions or commentaries are based.
The data and information presented herein are for informational and educational purposes only. This article is not an official statement. The correlation or comparison of various indices against one another, against certain investment strategies or against the market is based upon data over a certain time period. These correlations may vary substantially in the future or over different time periods that can result in materially different outcomes. All investing involves risk of loss, including the possible loss of all amount invested.
This article shall not constitute an offer to sell or the solicitation of any offer to buy any interests in any LongTail investment product or strategy. Past performance is no indication of future results.
Information furnished by others is presumed to be reliable, and has not been independently verified by LongTail. No responsibility, whether legal or otherwise, is assumed for its accuracy, and it cannot be guaranteed as being certain. No single item of information was completely relied upon to the exclusion of other information. There is no guarantee that any investment strategies discussed herein will work under any or all market conditions or are suitable for all investors. You should evaluate your ability to invest long-term, especially during periods of downturn in the market. Investors should be prepared to sustain a complete loss of an investment. Investment strategies mentioned herein are speculative in nature and do not represent a complete investment program.
Nothing herein is intended to imply that any investment strategy included in this article may be considered “conservative”, “safe”, “risk free” or “risk averse.”
Certain information contained herein constitutes “forward looking statements,” which can be identified by the use of forward- looking terminology such as “may,” “will,” “expect,” “anticipate,” “target,” “project,” “estimate,” “intend,” “continue” or “believe” or the negatives thereof or other variations thereon or comparable terminology. Due to various risks and uncertainties, actual events, results or actual performance may differ materially from those reflected or contemplated in such forward-looking statements.